

Ethereum remains stagnant in a no-trade zone that is getting narrower over time. Patience is advised until ETH can break out of this tight price pocket.
Ethereum at a Crossroads
Traders appear to be growing impatient as Ethereum continues to consolidate within a tight price range.
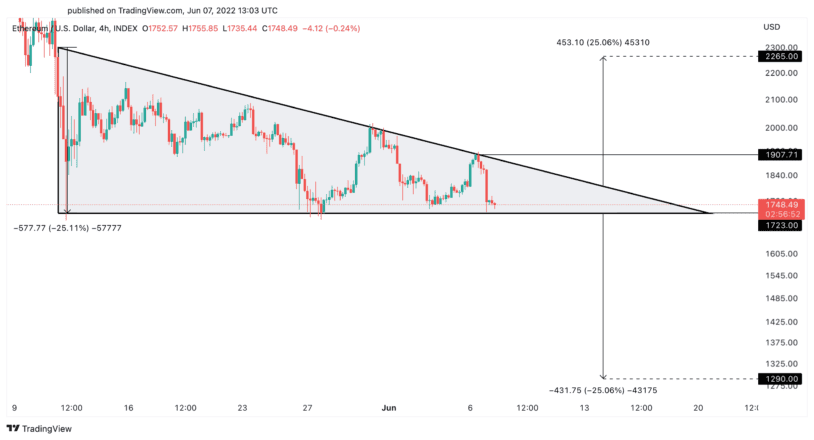
Data from Coinglass has revealed that roughly $1.5 billion worth of long and short ETH positions have been liquidated across the board over the past three weeks. In the meantime, Ethereum has been locked in a no-trade zone that is getting narrower over time. The token’s price action has defined two critical price points that will likely determine where prices are heading next.
Ethereum has developed a descending triangle on its four-hour chart. This technical formation prevails that a break below the X-axis or above the hypotenuse could result in a 25% price movement in either direction. A sustained close below $1,700 or above $1,900 will likely resolve the ambiguity that ETH currently presents.
Dipping below support could result in a downsizing toward $1,300, while overcoming resistance might encourage sidelined investors to re-enter the market and push Ethereum up to $2,270.
Despite the ambiguous technical outlook, on-chain data shows that many large Ethereum whales are exiting their positions, indicating fears of a further decline.
Data from Glassnode reveals that the number of addresses with a balance greater than 10,000 ETH has declined by 1.51% in the past three weeks. Roughly 18 whales have either left the network or redistributed their holdings. Although this sum may seem insignificant at first glance, it is worth noting that each of these addresses held at least $20 million worth of ETH.
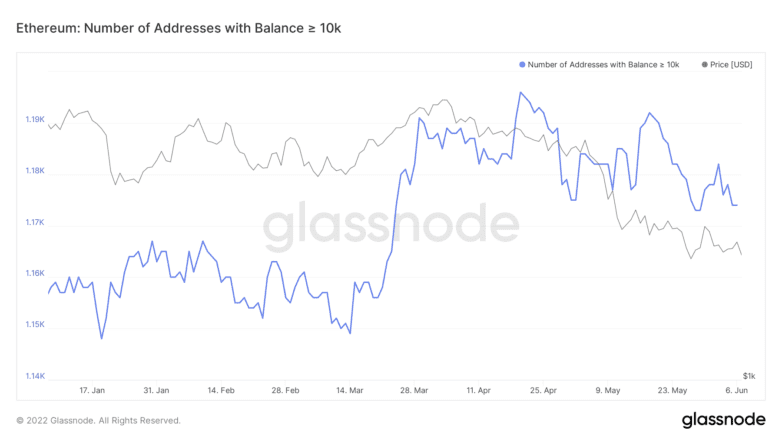
This rise in selling pressure from whales could be tampering with Ethereum’s ability to rebound. Still, a decisive four-hour candlestick close outside of the $1,700-$1,900 no-trade zone could help determine which direction ETH will move over the coming weeks.
Disclosure: At the time of writing, the author of this piece owned BTC and ETH.